BC ERP-system — Transforming Operational Chaos into a Data-Driven Platform
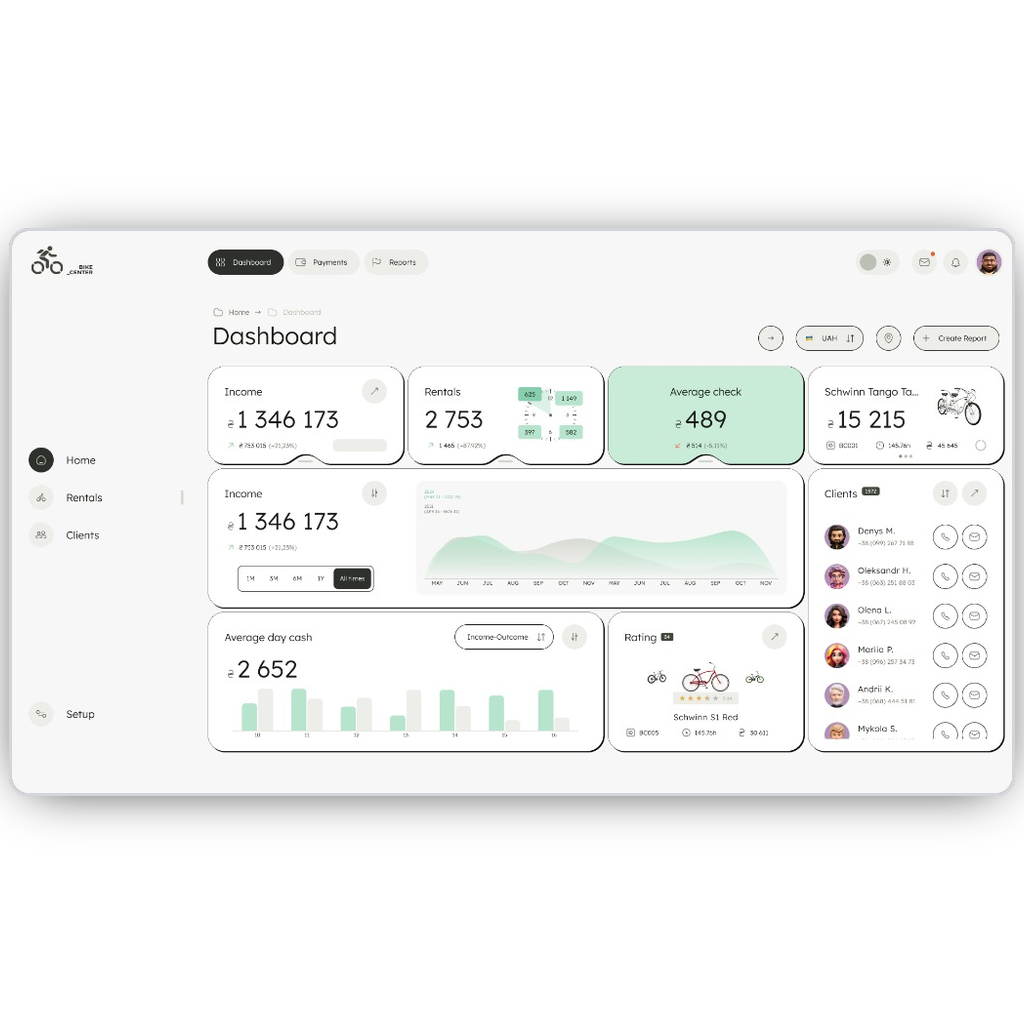
BC ERP-system is designed for operational and strategic management of Bike Center Zaporizhzhia (bc.zp.ua). It consolidates key operational metrics: Gross Income (₴895,841+), Net Profit Margin (43.0%), Rental Starts/Ends (218), Average Check (₴120), fleet utilization (Top/Low Performing Bikes), and a customer database of 1558+ profiles.
Project & Context
Project: BC ERP-system (bc.zp.ua)
Tech Stack: Next.js (React), TypeScript, Tailwind CSS, Vercel Edge Network, Modular SVG/Micro-charts, UI/UX Design System.
Core Goal: Transform local operational chaos into a precision data-driven management platform.
A Single Source of Truth for Bike Center Zaporizhzhia combining financial bookkeeping, Fleet Management, peak load analytics, and customer profiles into a lightning-fast responsive interface.
Problem & Challenges
Rental logs, bike conditions, and revenue entries were scattered across paper logbooks and disconnected spreadsheets, preventing real-time analytics.
Lack of exact rental hour tracking led to high wear on popular bikes (e.g. Leon TN80) while other units sat idle.
Demand spikes during specific time windows (13:00–14:00 & 15:00–16:00) required data forecasting to optimize staff scheduling and maintenance.
Field managers and executives needed instant mobile access without slow page loads or complex navigation.
Data Architecture & Scalability
Clean object hierarchy: Client ↔ Rental Event ↔ Inventory Item (Bike) ↔ Financial Ledger.
SSR and Next.js caching on Vercel Edge Network yield sub-second load times (< 1.0s LCP).
Instant calculation of historical metrics (Gross Income ₴895,841+, Net Margin 43.0%, +12.4% rental growth).
Multi-location support, POS integration, and GPS telemetry ready.
Input Data
Client data acquisition, verification process, order details, and rental equipment info.
Routing & Caching Data
Server-side rendering (SSR), zero latency, and data leak prevention.
Rental Flow Chart & Metrics
Period cash flow tracking (Revenue, Expenses, Profit), key operational averages, and performance ratios.
Fleet Telemetry
Equipment popularity, rental profitability, and real-time wear-and-tear monitoring.
Expanded Data & Reports
Financial reporting, inventory management, invoice generation, customer profiles, and instant cross-system navigation.
Responsive UX Engine
Tailored for administrators on smartphones and tablets in real-world rental hub environments.
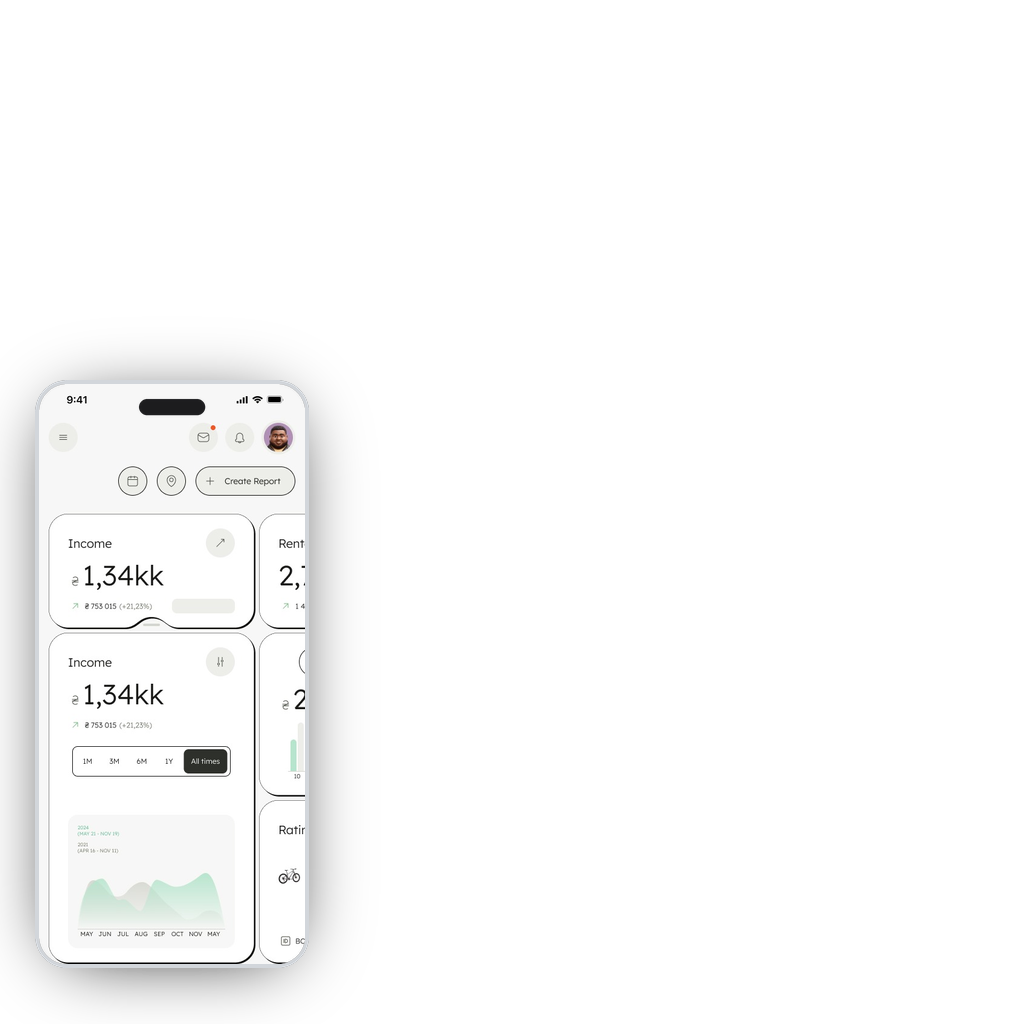
Reflows seamlessly from multi-column desktop Bento dashboards to compact mobile card feeds.
Bike cycler controls (Previous / Next bike), client search filters, and active state feedback tuned for touch.
Desktop (1440px+)
4-column Bento layout with high data density, detailed tables, instant search, and micro-charts.
Tablet (768px - 1024px)
Touch-optimized split-view for rapid rental check-in/check-out and inventory scanning at counter hubs.
Mobile (390px)
Single-column swipeable cards, quick bike cyclers, floating status widgets, and touch-first controls.
Core System Modules
Gross Income (₴895,841), Net Margin (43.0%), Average Check (₴120 [-5.11%]).
Rental Starts/Ends (218 [+12.4%]), Peak Hour Detection (13-14 & 15-16).
Bike Performance Card (ID: BC025 Leon TN80 17.5"/29", 52.2h, ₴8,800 revenue, 1st place).
Customer directory with thousands of profiles (1558+ active), direct contact buttons, and rental history.
Design System & Accessibility
The system features a well-conceived semantic base structure and modular design. The implementation of a strict design system with fixed color/spacing tokens and a focus on advanced ARIA mapping makes this dashboard fully compliant with WCAG AA standards.
Optimizing the layout interface for split-second scanability and lower mental load
Modular Structure
Clean grid system using repeating UI components: metric KPI cards (Income, Rentals Start), asset cards, and customer lists.
Consistent States
All cards share uniform trend dynamics presentation (+12.4%, -5.11%), lowering cognitive load and speeding up comprehension.
Information Hierarchy
Key metrics prioritize scale using Display/H1/H2 font sizes, while supporting context is aligned in secondary labels.
Business Impact & Results
Deployment of BC ERP-system transformed operational metrics across Bike Center Zaporizhzhia.
Below is a comparison of key workflows before and after implementing the system:
| Metric / Area | Before | After | Result |
|---|---|---|---|
| Revenue Transparency | Estimates "by eye" at month-end, cash ledger discrepancies | Precise online calculation of Net Margin (43.0%) and Gross Income (₴895,841) | 100% Accuracy |
| Rental Efficiency | Uneven and untracked depreciation of individual bikes | Clear ranking by logged rental hours (e.g. BC025 Leon TN80 — 52.2h / ₴8,800) | Wear Optimization |
| Resource Management | Customer congestion and bottlenecks during peak rental hours | Peak load forecasting, load analysis, and work flow optimization (13:00-14:00 & 15:00-16:00) | -65% Bottlenecks |
| Service Speed | Complex database navigation, slow information processing (Main User Flow 3-15 min) | Instant navigation and operational process acceleration up to 1 second | 3.5x-10x Speedup |
GetTogether — Mobile App & Map
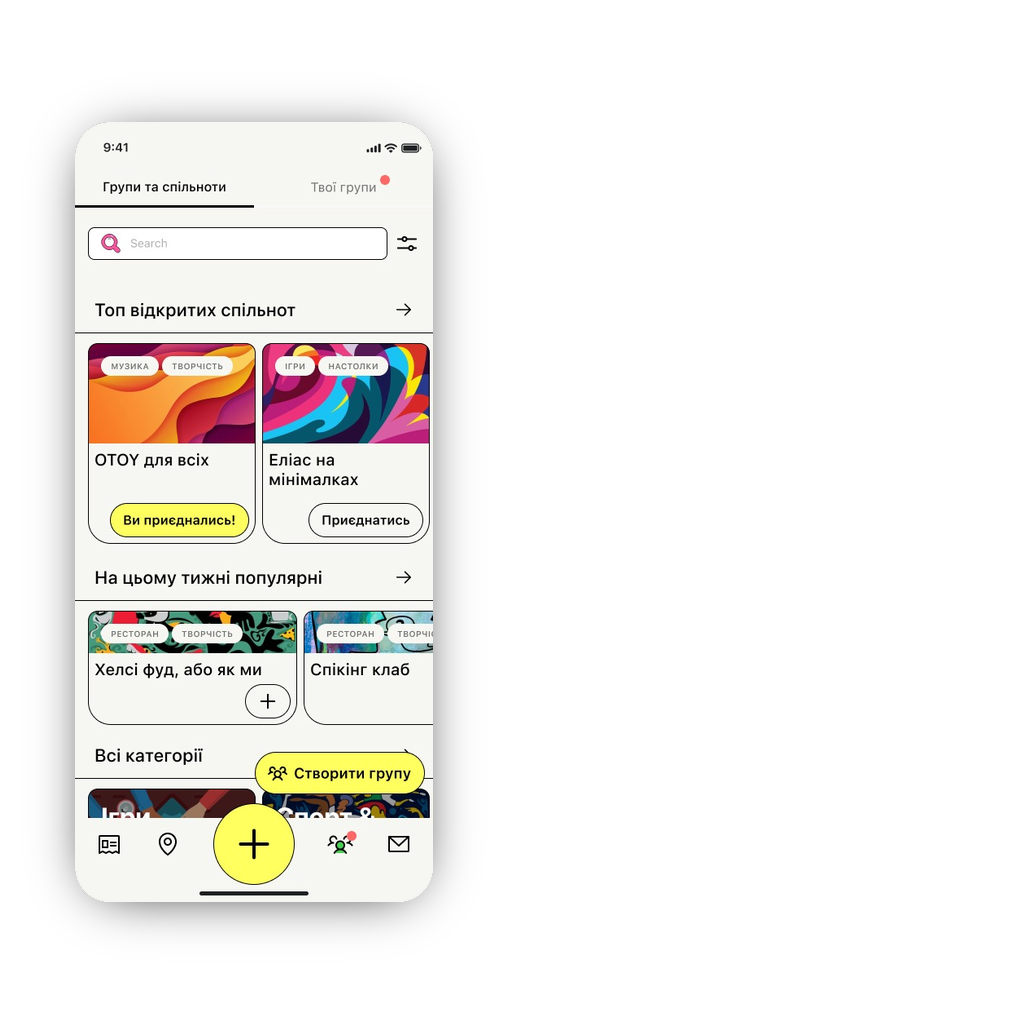
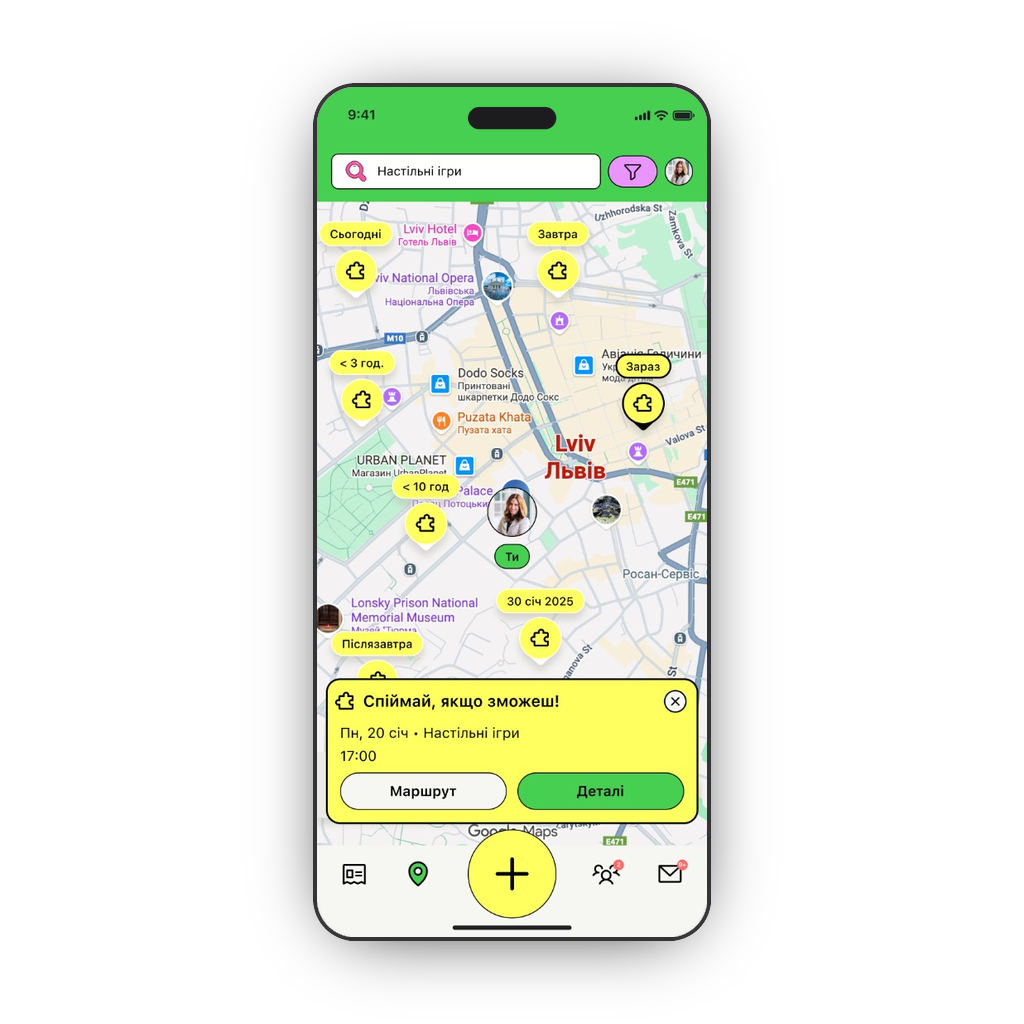
A mobile application and interactive city map helping youth find events, social gatherings, and themed communities.
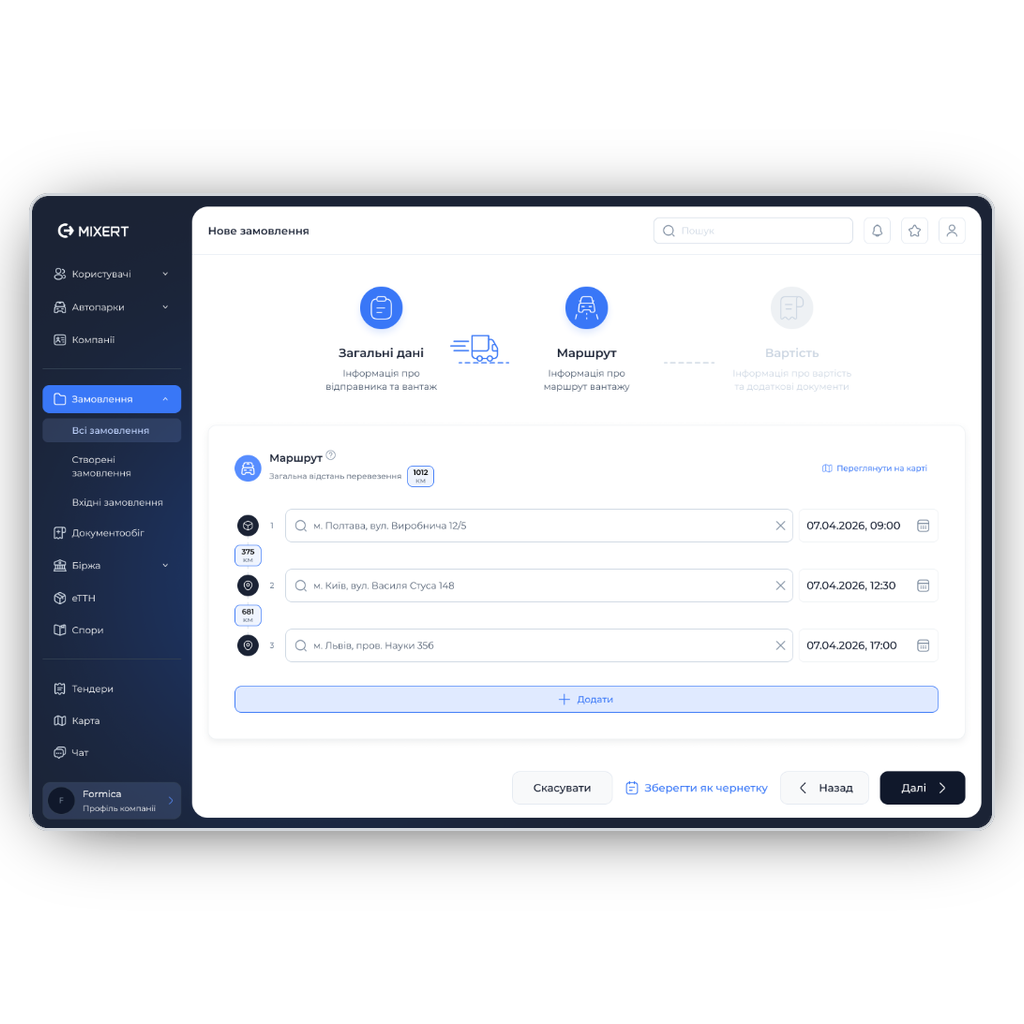
"Mixert" SaaS platform
An enterprise B2B dispatch portal managing freight routes, cargo bidding, and logistical workflows.